Website analytics at your fingertips
Have you ever wondered what’s going on behind the scenes of your website? A lot of our clients are curious about their web analytics, but aren’t sure how to access them or what all the numbers mean. We’re making this easier for you.
You now have access to Google Site Kit
Whether you’re a novice or an analytics pro, Google Site Kit is an easy new way to get stats at a glance. Discover the demographics of your audience, including what devices they’re using to access your site, what pages they visit, and how they engage with your content. The best part? This can all be viewed from the backend dashboard of your website. Let’s take a tour!
Your Dashboard
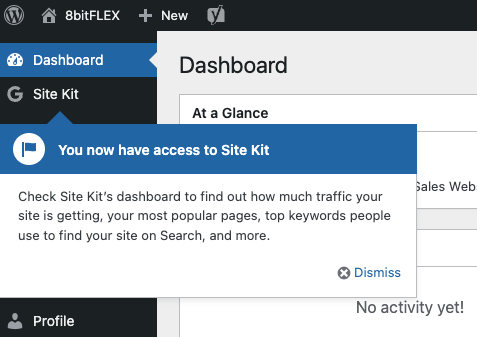
When you first log in, you may get a notification that you now have access to view Site Kit. The link for Site Kit will be beneath your Dashboard panel at the top of the page. Simply click on Site Kit to get started.

Traffic by Channel, Location & Device
The first thing you’ll see on your Site Kit dashboard is your site traffic. By default, the view is data tracked over the last 28 days. If you’d like to change the date range, click on the calendar icon at the top right of the page. Once you have your date range selected, you’re set to view your analytics.
You can click or hover on most of the elements on your dashboard to navigate around. Click on sections of the line graph to see date specifics, switch views at the top of the donut graph, and click inside the colored sections of the graph to get more insights.
Impressions, Clicks & Unique Visitors
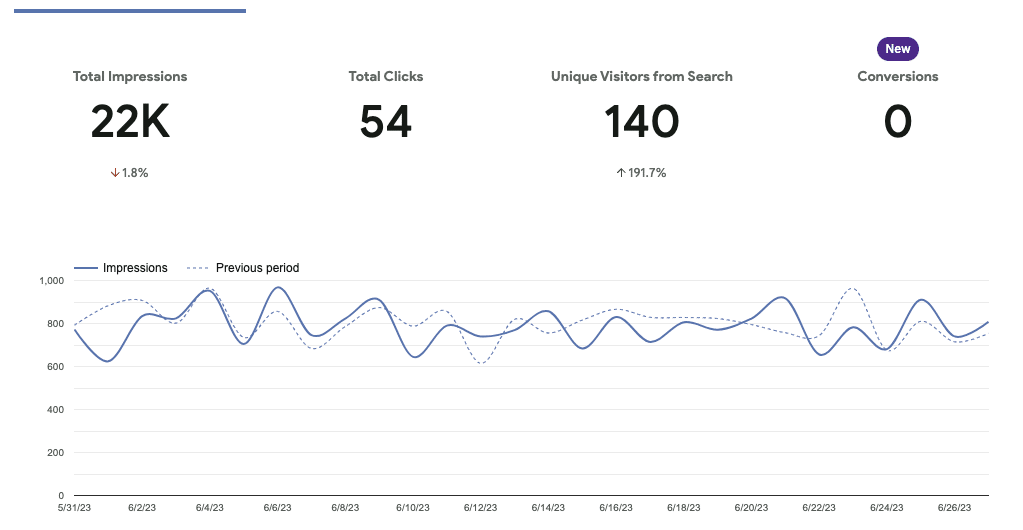
This section allows you to compare traffic patterns from previous periods, including how many unique visitors from search engines visit your site. If your curious what search terms are attracting visitors, scroll down! The next section features the top search queries that lead to clicks and impressions on your site. (We rank for “design agencies minneapolis.”)

Pages, Sessions & Engagement Rates
Sessions and engagement rates are handled a little differently in Google Analytics 4 (GA4). Sessions are visitor interactions on your site within a given timeframe (defaults to 30 minutes). Engagement rate now replaces bounce rate, and includes sessions that lasted at least 10 seconds, had one or more conversion events, or had 2 or more page views. Session duration is a calculated average of all engaged sessions divided by the number of sessions for a given page.

This is just a quick rundown of how to use your Site Kit dashboard. For advanced analytics tracking and deeper insights, we recommend familiarizing yourself with your GA4 dashboard at analytics.google.com. If this all still seems overwhelming, we’re happy to help! Set up a tour or training session with our team today.


